This post serves as my 2025 Year-End income update, complementing my Year-End asset allocation and performance review. Although I don’t concentrate on high-dividend stocks or covered-call strategies, I still monitor the income generated by my portfolio as a valuable measure alongside price performance. The overall income tends to grow more consistently and gradually than the figures shown in brokerage statements, which motivates steady investing. As Jack Bogle wisely noted:
“The true investor will do better if he forgets about the stock market and pays attention to his dividend returns and to the operating results of his companies.” – Jack Bogle
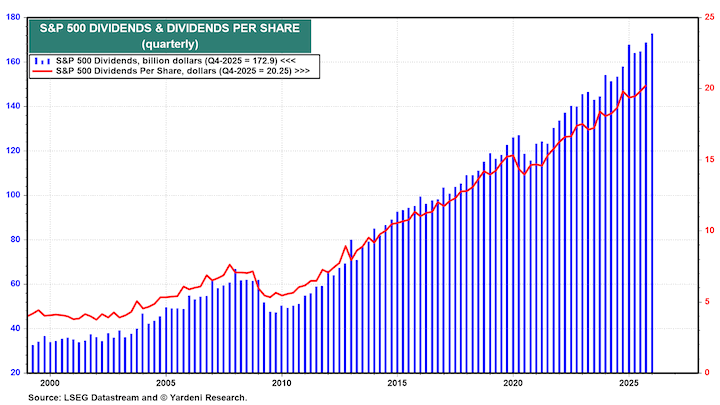
Dividends are a portion of profits that companies choose to distribute directly to their shareholders, rather than reinvesting it in the business, paying off debts, or repurchasing shares. By releasing a portion of profits, these companies indicate they don’t require the money to enhance their operations, and believe it is more beneficial to share it with shareholders. Although dividends may experience short-term fluctuations, they have shown a tendency to outpace inflation over the long run.
The historical growth of the S&P 500 total dividend, which represents the largest 500 companies in the U.S., has been updated for Q4 2025 (courtesy of Yardeni Research):
Income Tracking from My Portfolio Three key contributors to my income are the Vanguard Total US Stock ETF (VTI), Vanguard Total International Stock ETF (VXUS), and Vanguard Real Estate Index ETF (VNQ).
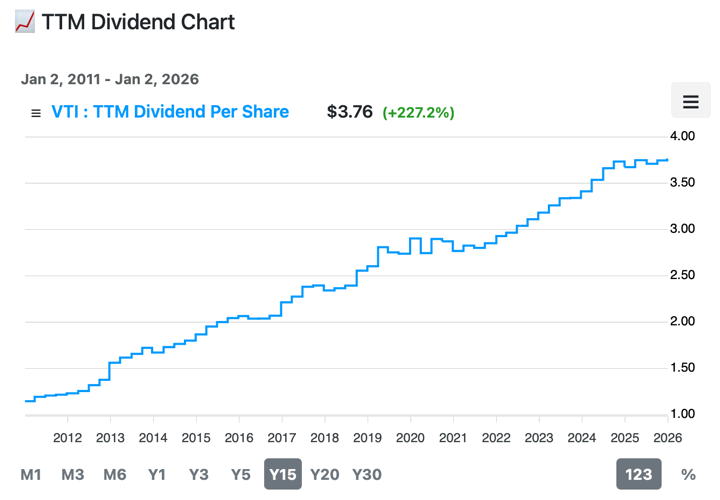
In the U.S., dividend culture tends to be conservative; shareholders anticipate stability and increases in dividends. As a result, the initial yield may be lower, but it tends to grow steadily with fewer reductions during downturns. Companies often favor stock buybacks instead because they can be more easily halted. Below is an updated chart showing the trailing 12-month dividend per share over the last 15 years for the Vanguard Total US Stock ETF (VTI) from WallStNumbers.com.
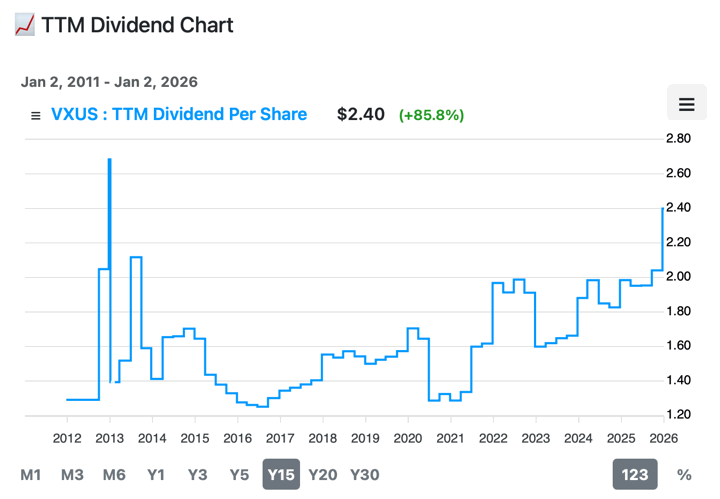
European corporate culture tends to favor distributing a higher (and sometimes fixed) percentage of earnings as dividends, indicating more fluctuation in dividend payouts with earnings. While current yields may be higher, they may not experience the same reliability in growth. The chart below reflects the trailing 12-month dividend per share from the Vanguard Total International Stock ETF (VXUS) over the past 15 years.
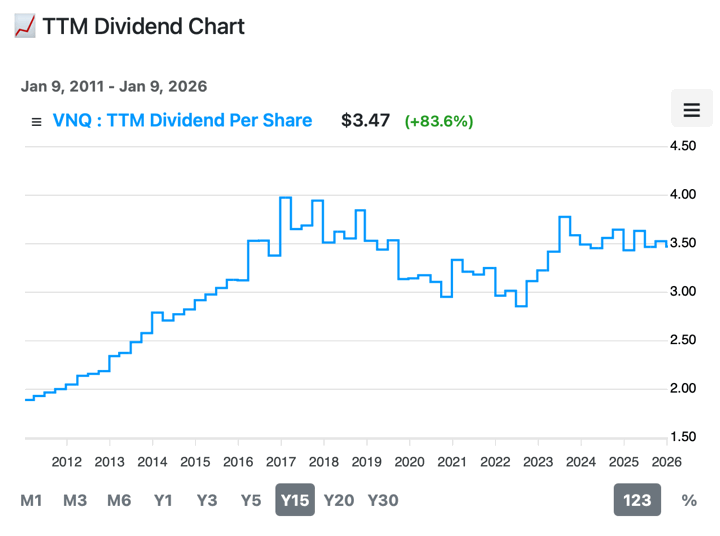
Real Estate Investment Trusts (REITs) are legally obligated to distribute at least 90% of their taxable income as dividends to shareholders. Historically, approximately half of the total return from REITs derives from dividends. Below is the chart reflecting the trailing 12-month dividend per share from the Vanguard Real Estate Index ETF (VNQ) over the last 15 years.
The dividend yield, calculated as dividends divided by price, also serves as a rough valuation tool. Typically, when stock prices decline, this yield increases, providing reassurance during bear markets. Conversely, when stock prices rise, the yield tends to decline, helping to temper exuberance during bull markets.
Lastly, another source of income in my portfolio comes from interest generated by bonds and cash. Investments like the Vanguard Short-Term Treasury ETF (VGSH) and Schwab US TIPS ETF (SCHP) fluctuate with prevailing interest rates, real rates on TIPS, and current inflation rates.
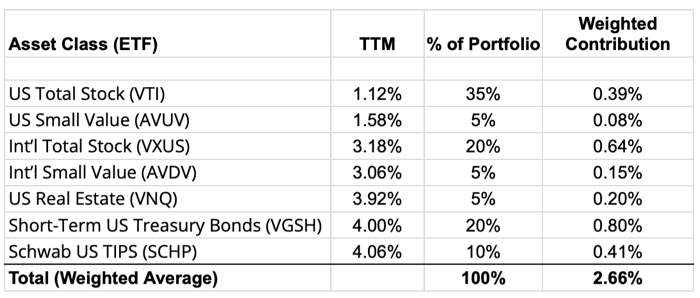
Estimating Dividend and Interest Income Yield To calculate the income from my portfolio, I use the weighted “TTM” or “12-Month Yield” from Morningstar (as of 1/4/26), which sums the trailing 12 months of interest and dividend payments divided by the last month’s ending share price (NAV) plus any capital gains distributed (generally zero for index funds) over the same period. My current TTM portfolio yield stands at approximately 2.66%.
Within dividend investing circles, there is a metric called yield on cost, calculated by dividing the current dividend by the original purchase price. This highlights that while my portfolio yield today is 2.53% due to a higher current market price, the yield-on-cost based on my portfolio value from 10 years ago exceeds 5% due to the overall increase in dividends over time.
Considering the 4% Rule As a rough guideline, I advocate for the 4% or 3% rule of thumb for estimating financial needs, which translates to accumulating approximately 25 to 33 times your annual expenses. I would recommend a 3% withdrawal rate if aiming for early retirement (around age 50) and a 4% withdrawal rate for a more traditional retirement age (around 65). It’s a straightforward starting point rather than a strict directive!
During the accumulation phase, focusing your energy on enhancing your earning potential is more beneficial through better career choices, skill development, networking, or exploring entrepreneurial avenues with promising returns.
Our dividends and interest income aren’t automatically reinvested; they represent an additional “paycheck.” We can choose to spend this income or reinvest it for faster compounding. This flexibility allows us to decrease working hours, explore new career paths, start businesses, take sabbaticals, or engage in volunteer work, among other options. You don’t need to wait until reaching a certain target. This philosophy has significantly shaped our life journey. FIRE is Life!